.png)
UP, DOWN, EVEN: Market Metrics
- Aug 2, 2019
- 3 min read

UP, DOWN, EVEN: Market Metrics
The first half of 2019 seems to support a stabilizing market in 2019, with both prices and closings up compared to this time last year. However, these promising signs for overall market health might be due in part to a dramatic increase in new development sales in the second quarter. Most of these sales entered contract well before the start of 2019, and so are not truly indicative of the current market. Contracts signed, a better indicator of actual market activity, did see a momentary spike in April, but it’s likely much of this was attributable to buyers rushing to close before the new state transfer and mansion taxes took effect on July 1st.
Inventory in Manhattan increased year-over-year again this spring, a now familiar trend we’ve seen since the end of 2017. Active listings surpassed 8,000 for the first time since 2011, even though there was actually less new inventory introduced to the market in the first half of this year than last. Marketwide absorption rates have continued to lag, making for a continued buyers’ market, although a modest increase in median co-op sales prices did manage to offset yet another year-over-year decline in condo sale prices. Overall, properties with low monthlies and competitive pricing have continued to transact well, but luxury new development and condo resales continue to linger on the market. Midtown, FIDI, and both the Upper East and Upper West Side markets saw year-over-year drops in both condo and co-op resale prices, while both Downtown and Upper Manhattan saw a year-over-year increase in prices across all product types.
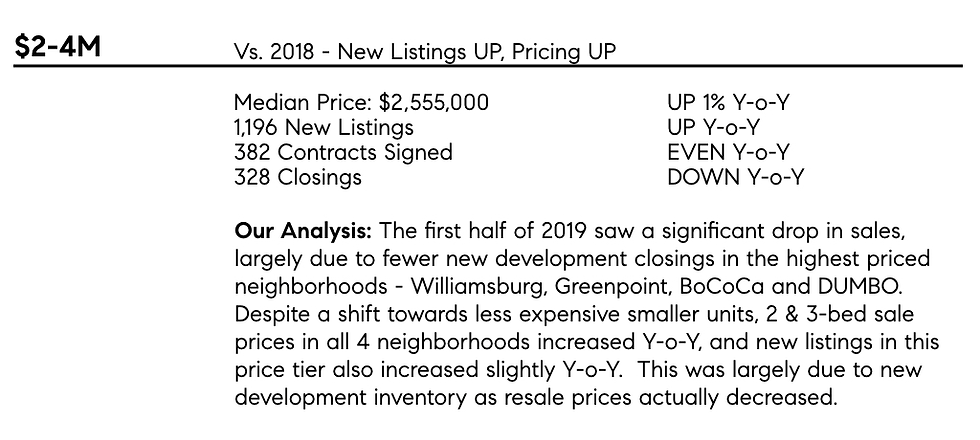
In Brooklyn, the number of sales fell short of last year’s record-breaking spring selling season. But 2019 has still been a strong year. Over 2,700 apartments closed between January and June, one of the highest figures recorded in the past decade, and median sale price figures saw year-over-year increases across all price-tiers and almost all product types. While resale closings declined year-over-year, new development sales increased to balance these drops, accounting for a notably high 32% of the total market share. Contract activity also continued to decline, a trend we’ve observed since the start of 2018 – unlike Manhattan, where buyers felt pressure to beat the new mansion tax, Brooklyn appears unaffected by these changes which changed the rates above $2M, a very small segment of the Brooklyn market.
Inventory levels in Brooklyn also rose in the first half of 2019 by double digits compared to the same time last year – while the largest spike was due to new development inventory, all product types saw an increase from the extremely constricted levels found in both 2017 and 2018. Co-op inventory, while up from Spring 2018, made up only 1/3 of all active inventory this year, representing a 9-year low in market share. Resale condo inventory increased year-over-year by double digits, although interestingly, also saw a rather unexpected increase in sale price not typical of increased inventory levels.
The median sale price for 2-bedroom condo resales also broke $1M for the first time in the second quarter, and resale co-ops also saw double digit increases in median sale price for 1, 2 and 3-bedroom homes. Despite an increase in inventory and decline in contracts and closings, prices were up and days on market declined compared to the same time last year.

Manhattan Marketwide


Manhattan By Segment


Brooklyn Marketwide


Brooklyn By Segment


Click here to download the full report.


Comments