top of page

UP, DOWN, EVEN: Market Metrics

The first half of 2019 seems to support a stabilizing market in 2019, with both prices and closings up compared to this time last year. However, these promising signs for overall market health might be due in part to a dramatic increase in new development sales in the second quarter. Most of these sales entered contract well before the start of 2019, and so are not truly indicative of the current market. Contracts signed, a better indicator of actual market activity, did see a momentary spike in April, but it’s likely much of this was attributable to buyers rushing to close before the new state transfer and mansion taxes took effect on July 1st.

Inventory in Manhattan increased year-over-year again this spring, a now familiar trend we’ve seen since the end of 2017. Active listings surpassed 8,000 for the first time since 2011, even though there was actually less new inventory introduced to the market in the first half of this year than last. Marketwide absorption rates have continued to lag, making for a continued buyers’ market, although a modest increase in median co-op sales prices did manage to offset yet another year-over-year decline in condo sale prices. Overall, properties with low monthlies and competitive pricing have continued to transact well, but luxury new development and condo resales continue to linger on the market. Midtown, FIDI, and both the Upper East and Upper West Side markets saw year-over-year drops in both condo and co-op resale prices, while both Downtown and Upper Manhattan saw a year-over-year increase in prices across all product types.

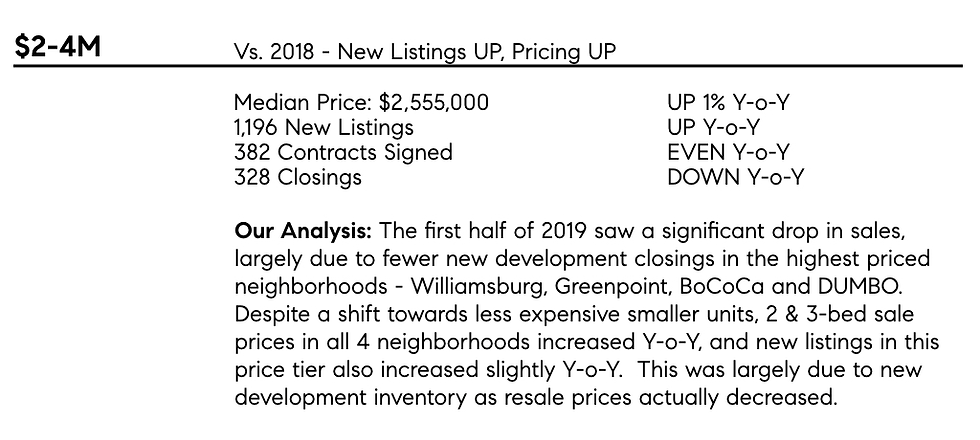
In Brooklyn, the number of sales fell short of last year’s record-breaking spring selling season. But 2019 has still been a strong year. Over 2,700 apartments closed between January and June, one of the highest figures recorded in the past decade, and median sale price figures saw year-over-year increases across all price-tiers and almost all product types. While resale closings declined year-over-year, new development sales increased to balance these drops, accounting for a notably high 32% of the total market share. Contract activity also continued to decline, a trend we’ve observed since the start of 2018 – unlike Manhattan, where buyers felt pressure to beat the new mansion tax, Brooklyn appears unaffected by these changes which changed the rates above $2M, a very small segment of the Brooklyn market.

Inventory levels in Brooklyn also rose in the first half of 2019 by double digits compared to the same time last year – while the largest spike was due to new development inventory, all product types saw an increase from the extremely constricted levels found in both 2017 and 2018. Co-op inventory, while up from Spring 2018, made up only 1/3 of all active inventory this year, representing a 9-year low in market share. Resale condo inventory increased year-over-year by double digits, although interestingly, also saw a rather unexpected increase in sale price not typical of increased inventory levels.

The median sale price for 2-bedroom condo resales also broke $1M for the first time in the second quarter, and resale co-ops also saw double digit increases in median sale price for 1, 2 and 3-bedroom homes. Despite an increase in inventory and decline in contracts and closings, prices were up and days on market declined compared to the same time last year.

Manhattan Marketwide

Manhattan By Segment

Brooklyn Marketwide

Brooklyn By Segment

Click here to download the full report.


UP, DOWN, EVEN: Market Metrics

With contracts up and number of new listings down (relative to both Q3 and Q4 2017), Q4 in Manhattan seemed to signal a normalizing market after a lagging Q2 and Q3 where we saw an adjustment in prices and lower transaction volume. Lower prices (median sale price down more than 2% Y-o-Y and median PPSF down more than 4%) finally spurred buyers into action starting around November which combined with lower levels of new inventory, has led to greater absorption at the end of the year. We expect further normalizing in the market in 2019 especially with interest rates having dipped to levels not seen in the past year.

Brooklyn remained stable through 2018 as limited resale inventory continues to keep pricing strong. While median sale prices decreased slightly across all of the sub-$2M strata of the market, Brooklyn’s overall median sale price was down just 1% year-over-year. Brooklyn resale inventory was also extremely low in all four quarters of 2017, hitting a 5-year record low in Q4 2017. This resulted in an uncommonly high percentage of bidding wars and over-ask sale prices. As inventory levels normalized over the course of 2018, buyer urgency has decreased, and the seemingly meteoric rise in prices the borough has seen over the past few years has been curbed by the 2018 market. However, another factor in the slight downward shift in prices came from a continuing trend of increased market activity in lower priced areas, as buyers seek value in neighborhoods that traditionally held far less market share than “prime” northern and western Brooklyn.

Below is our breakdown of marketwide trends in Manhattan and Brooklyn.

For more information and neighborhood specific data, check out Compass's Q4 Manhattan report here.

For more information and neighborhood specific data, check out Compass's Q4 Brooklyn report here.

Download our entire market report here.


Manhattan

Overall Inventory at All-time Highs in Manhattan

Manhattan inventory has reached new highs, exceeding even levels from mid-2009 at the worst point in the last recession. Old listings lingering on the market have caused an unprecedented number of price cuts, and new listings are flooding the market (often with lower prices) at a pace not seen before (more new listings were reported in September than in any other month since Streeteasy has been hosting listings). What has been interesting is that the slowdown has taken a hold of the entire market — even the usually resilient under-$1M market. This would be a great time to get in the market — where asking prices have come down and most are negotiable on top of that. What has been interesting is that the slowdown has taken a hold of the entire market — rather than proving resilient, the under $1M market has been most affected by the surplus in inventory.

Median Prices Down

The overall Manhattan median asking price continued to decrease in Q3 2018 by 11% Y-o-Y to $1.55M compared to the same period in 2017. As aforementioned, sellers reduced asking prices and accepted further discounts to seal the deal; we see these factors as positive signs for prospective buyers. Condo median asking price declined 9% Y-o-Y to $2.2M, registering the lowest asking price in 4 years since 3Q 2014. While co-op median asking price declined 13% Y-oY to $995K, registering the lowest asking price in 3 years since 3Q 2015. This decrease was market-wide except for NoHo & Nolita, Harlem & Upper Manhattan, and Midtown West, which exhibited Y-o-Y increases in the median asking prices ranging from 7% to 12%.

The total number of closings decreased 18% Y-o-Y during Q3 20181 to 2,616 transactions, consisting of 1,163 condos (44% of total) and 1,453 co-ops (56% of total). Furthermore, all price segments exhibited Y-o-Y sales price declines ranging from 6% to 33%. Closings above $10M saw the lowest Y-o-Y percentage decline of 6% from 55 closings in Q3 2017 to 52 closings in Q3 2018. Closings between $5M - $10M declined by the highest percentage (-33% Y-o-Y), which was attributable to 34 clustered closings at Madison Square Park Tower in Q3 2017.

Deals on New Development, particularly in the Downtown Market

New development inventory — especially downtown — is at an all-time high, with an absorption time, on average, between 7-9 months on-market. There were over 1000 units on the market in August, but only 85 contracts signed. This does not even paint the whole picture, as only a fraction of available new development units are actually listed publicly. It is estimated that there are 2,000+ more units in the pipeline.

There are significant deals (15-30% of listing prices) in the $10M-plus market. Even at the lower levels ($2.5-6M) we are seeing creative concessions and significant variances from asking prices. In this segment, my team recently represented a buyer of a 3-bedroom downtown new development and were able to negotiate almost 15% off of the asking price and host of other concessions.

Other new developments in coveted locations and with star-chitect cachet are publicly marketing concessions on real estate taxes, a telling departure from the backroom deals that usually take place in this ultra-luxury market.

Possible Causes & What's Next?

It is hard to pinpoint a single specific cause of the slowdown. The economy is strong and New York continues to offer a strong and highly sought-after job market. Surplus inventory and over-building could account for the lag on the higher end, but the picture is murkier for the lower end of the market. I suspect the culprit is uncertainty regarding the impact of the recent tax changes. Given the IRS's lack of guidance, most accountants have been in the dark about the financial implications of the changes for their specific clients. I believe uncertainty often causes paralysis, and as more buyers experience hesitation a herd mentality develops.

Most real estate professionals agree that this is a passing blip, rather than the indicator of a long-term downward adjustment in prices. As such, it presents a unique opportunity to take advantage of deals in a strong buyer's market — with very few other buyers actually transacting. During other slowdowns, vulture investors made huge gains by betting on the market during low points.

This would be a great time to get in the market -- where asking prices have come down and most are negotiable on top of that. Read the full report here.

“Rising” Interest Rates are Not a Bad Sign

Rising interest rates may be to blame for the slow down of Manhattan’s market, but this isn’t necessarily a bad sign. Yes, interest rates are going up, but this should be viewed as a correction rather than a sign of a crashing economy -- while 30-year fixed mortgage rates are approaching 5%, it shouldn’t be forgotten that three years ago they were over 18%. While rates are rising, this just comes after irregular lows. With the current market, inventory is at an all-time high allowing buyers to have their pick of the litter and negotiate on asking price -- all before rates rise further and inflation kicks in. Rates have been hovering around 4.375 - 4.5% (jumbo, 30-year fixed) and around 5% on conforming loan recently.

Brooklyn

Inventory

Brooklyn’s Q3 market proved to be much stronger for sellers than Manhattan’s market due to a decrease in inventory (much unlike the influx in inventory across the River). Brooklyn experienced a 7% year-over-year (“Y-o-Y”) decline in inventory, decreasing from 1,681 active listings in Q3 2017 to 1,563 active listings in Q3 2018. Inventory priced below $500K declined by 25% and had a decline in median days on market (61 days in Q3 2018 compared to 106 days in Q3 2017) indicates healthy absorption levels in this sector of the Brooklyn market.

Median asking price increased by 5% Y-o-Y to $995K this quarter. Furthermore, median asking price in all three property types saw double-digit Y-o-Y increases reaching 10-year highs after dips in Q1 2018; condo median asking prices increased 11% Y-o-Y to $1.2M, co-op median asking prices increased 13% Yo-Y to $565K, and single family median asking prices increased 10% Y-o-Y to $2.1M.

Among all 12 submarkets analyzed, Downtown Brooklyn/Fort Greene exhibited the largest Y-o-Y increase (+28%) in the number of active units, primarily attributable to new developments such as Brooklyn Grove at 10 Nevins and Brooklyn Point at 138 Willoughby. Additionally, these new projects pushed median asking prices up by 31% Y-o-Y to $1.2M from $899K in Q3 2017. Brooklyn Heights/Columbia Street Waterfront experienced the largest Y-o-Y increase in median asking price of 51% to $1.98M, mainly led by numerous high-priced co-ops. Despite the slight Y-o-Y decline in median asking price, DUMBO remained the most expensive neighborhood in Brooklyn, with a median asking price of $2.4M in Q3 2018.

A Lack of New Development Closings/Contracts are Distorting the Data

New Developments that came on the market between 2015-2017 are mostly sold out at this point, and this has been affecting the number of contracts signed and closings in Q3 2018. The overall number of contracts signed decreased from 17% Y-o-Y to 676 units in Q3 2018 from 814 units in Q3 2017 can be attributed to the fact that many of these new developments were signed at this time last year. On a positive note, the $2M - $3M price segment exhibited a 14% Y-o-Y increase in velocity registering 56 contracts signed this quarter, mainly driven by the following factors: 1) rising interest rates, which pushed leveraged buyers to pull the trigger locking current financing terms before rates rise again; and 2) sellers having more reasonable price expectations and accepting discounts to get deals done.

Among the 12 submarkets analyzed, Greenpoint saw the steepest decline in number of contracts signed — down 62% Y-o-Y (16 contracts in Q3 2018 compared to 42 contracts in Q3 2017), and is a prime example of how neighborhoods with an explosion of new development projects are manipulating the market data. These new developments boosted contract velocity to record high numbers in preceding quarters, whereas this quarter’s contract velocity is mainly being driven by resales.

In Q3 2018, the total number of closings decreased 20% Y-o-Y to 1,099 transactions, consisting of 574 condos (52%), 373 co-ops (34%), and 152 single family homes (14%). The decline was primarily attributable to a large amount of clustered new development closings during Q3 2017, including 46 closings at 550 Vanderbilt, 42 closings at 184 Kent and 27 closings at 50 Greenpoint.

Read the full Brooklyn report here.

Compass_Logo_H_W.png
  • Instagram
  • Facebook
  • LinkedIn

Isil Yildiz Team

110 5th Avenue

New York, NY 10011


985-714-4470

Isil@Compass.com

realtor-logo-white-png-9-transparent.png

Compass is a licensed real estate broker and abides by Equal Housing Opportunity laws. All material presented herein is intended for informational purposes only. Information is compiled from sources deemed reliable but is subject to errors, omissions, changes in price, condition, sale, or withdraw without notice. No statement is made as to accuracy of any description. All measurements and square footages are approximate. Exact dimensions can be obtained by retaining the services of an architect or engineer. This is not intended to solicit property already listed.

bottom of page