top of page

While prices and sales volume declined again in the final quarter of 2019, Q4 actually saw the lowest rate of decline since the fall of 2017. An uptick in activity in the last month of the year -- and another drop in interest rates at the start of the year -- hopefully leads to further stabilization in the first half of 2020. Our analysis is below, along with links to Compass’s Q4 Market reports for even more data and details.

A “wait and see” approach by Manhattan buyers, coupled with anxious sellers, continued to weigh down prices this fall. As a result, 2019 price figures settled to their lowest year-end levels in five years, with average price falling 10% to $1.862M and median price—less skewed by high or low prices—slipping 3% to $999K to remain below $1M for a second quarter in a row. Manhattan’s luxury market saw sales over $5M drop 41%. It's important to keep some perspective on these figures: even at the lowest point this year, prices remained nearly 15% higher than ten years ago.

While days on market continued to increase, other metrics were neutral or slightly improved relative to the prior year. Manhattan sales volume were almost even with this time last year, and prices in some product types have begun to bounce back. Inventory is lower, and mortgage rates have remained steady. We saw a 1% uptick in resale co-op sales and an 11% boost in new development sales, but overall sales figures were brought down by a 13% drop in resale condo sales. Signed contracts in the final quarter, however, were up from 2018 figures for a third consecutive quarter—improving 4% annually—suggesting that demand, after four years of declines, may finally begin to absorb supply.

In a market hungry for improvement, the last quarter’s results leave us cautiously optimistic as we enter the new decade.

Manhattan Market Report

BROOKLYN

Much like the first half of 2019, sales activity in the second half of the year in Brooklyn moderated compared to a very strong 2018, though prices continued to rise. Average price across the borough hit its highest figure in any fourth quarter, and median price did the same, this year hitting a record high of $800,000. While these figures only represent a marginal increase, median price per square foot increased by double-digits in the final quarter of 2019. This reflects a shift towards smaller apartments, as many buyers chose to hold firm on price by opting for smaller homes -- indicative of a greater overall price sensitivity in the market.

Properties in the $500K-1M segment made up 36% of inventory in the final quarter, but accounted for 47% of closings, and competition for these units resulted in a 2% higher average price per square foot. For properties priced in the $1-2M range, inventory outpaced closings, but price per square foot increased 6% versus 2018 because units in this price tier were also 5% smaller compared to past years. Properties priced $2M and higher made up just 6% of all recorded sales, and these units offered the largest average discount. The $3M+ segment saw a decrease in average price per square foot, as more of this inventory was made up of townhomes instead of luxury condos compared to last year.

Days on market increased for properties over $1M as Brooklyn buyers also lost some of the sense of urgency that has driven the Brooklyn market to record-fast sales in previous years. By product type, co-ops had the smallest market share but moved the quickest, with 42% of listings entering contract in the first 59 days on market. Mirroring a trend across the river in Manhattan, condos (particularly new development), which commanded the highest average price per square foot figures in the borough, were the slowest to enter contract -- just 32% entered contract in the first 59 days, while 32% took 180+ days.

Brooklyn Market Report


UP, DOWN, EVEN: Market Metrics

The first half of 2019 seems to support a stabilizing market in 2019, with both prices and closings up compared to this time last year. However, these promising signs for overall market health might be due in part to a dramatic increase in new development sales in the second quarter. Most of these sales entered contract well before the start of 2019, and so are not truly indicative of the current market. Contracts signed, a better indicator of actual market activity, did see a momentary spike in April, but it’s likely much of this was attributable to buyers rushing to close before the new state transfer and mansion taxes took effect on July 1st.

Inventory in Manhattan increased year-over-year again this spring, a now familiar trend we’ve seen since the end of 2017. Active listings surpassed 8,000 for the first time since 2011, even though there was actually less new inventory introduced to the market in the first half of this year than last. Marketwide absorption rates have continued to lag, making for a continued buyers’ market, although a modest increase in median co-op sales prices did manage to offset yet another year-over-year decline in condo sale prices. Overall, properties with low monthlies and competitive pricing have continued to transact well, but luxury new development and condo resales continue to linger on the market. Midtown, FIDI, and both the Upper East and Upper West Side markets saw year-over-year drops in both condo and co-op resale prices, while both Downtown and Upper Manhattan saw a year-over-year increase in prices across all product types.

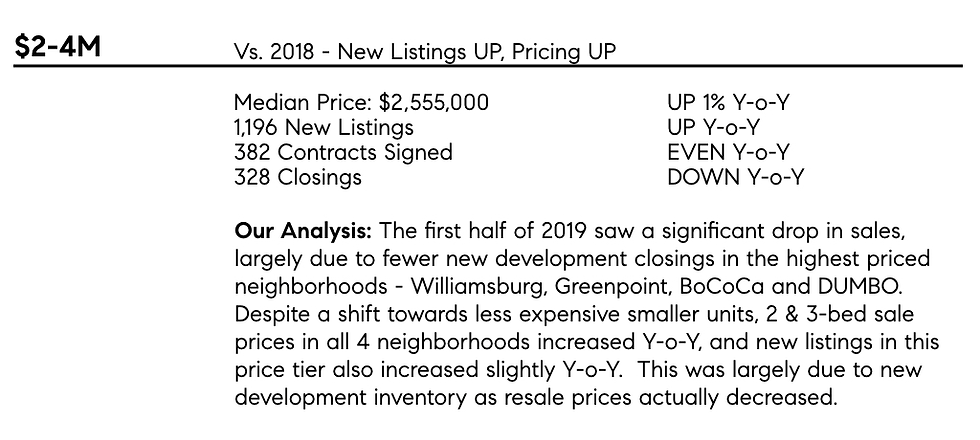
In Brooklyn, the number of sales fell short of last year’s record-breaking spring selling season. But 2019 has still been a strong year. Over 2,700 apartments closed between January and June, one of the highest figures recorded in the past decade, and median sale price figures saw year-over-year increases across all price-tiers and almost all product types. While resale closings declined year-over-year, new development sales increased to balance these drops, accounting for a notably high 32% of the total market share. Contract activity also continued to decline, a trend we’ve observed since the start of 2018 – unlike Manhattan, where buyers felt pressure to beat the new mansion tax, Brooklyn appears unaffected by these changes which changed the rates above $2M, a very small segment of the Brooklyn market.

Inventory levels in Brooklyn also rose in the first half of 2019 by double digits compared to the same time last year – while the largest spike was due to new development inventory, all product types saw an increase from the extremely constricted levels found in both 2017 and 2018. Co-op inventory, while up from Spring 2018, made up only 1/3 of all active inventory this year, representing a 9-year low in market share. Resale condo inventory increased year-over-year by double digits, although interestingly, also saw a rather unexpected increase in sale price not typical of increased inventory levels.

The median sale price for 2-bedroom condo resales also broke $1M for the first time in the second quarter, and resale co-ops also saw double digit increases in median sale price for 1, 2 and 3-bedroom homes. Despite an increase in inventory and decline in contracts and closings, prices were up and days on market declined compared to the same time last year.

Manhattan Marketwide

Manhattan By Segment

Brooklyn Marketwide

Brooklyn By Segment

Click here to download the full report.


UP, DOWN, EVEN: Market Metrics

While the data suggests that the Manhattan market continues to lag, the reality is much of the market (namely co-ops) seems to be bouncing back from last year’s slump with positive results in the first quarter. The surplus in new development inventory continues to depress condo prices in both new development and resale, which is bringing down the overall market outlook. Marketwide, average and median prices showed a decline, but prices for resale co-ops actually remained even with Q1 2018, and saw a 3% increase in both median sale price and median PPSF compared to Q4 2018. Closings declined by more than 5% Y-O-Y due mostly to double digit drops in condo closings (co-op closings declined a minimal 2%). The relatively strong numbers for the co-op and $1-2M markets in Manhattan is consistent with what we’ve seen on the ground as activity is significantly higher, and demand is stronger compared to the second half of 2018.

Similarly in Brooklyn, marketwide numbers are a bit misleading. While overall median prices have dropped, this is due to an ongoing shift of market activity to traditionally lower-priced neighborhoods. This trend pushed sale prices up in those areas yet again this quarter, but brought overall borough-wide sale prices down by 5% compared to last year. The total share of sales priced over $750,000 fell by 6% this quarter, while sales in Bedford-Stuyvesant, Crown Heights, Prospect Lefferts Gardens & Bushwick had twice the market share versus Q1 2018. Closings were also down, largely attributable to a six-year low in the condo market and a steep drop of new development closings, but the co-op market has remained stable with both closings and contracts signed essentially even year-over-year. Our prognosis is a stable market in traditionally higher-priced neighborhoods with continued scarcity of inventory, and a dramatic increase in prices and activity at the lower-end of the market as overall demand in Brooklyn remains strong.

Take a look below at a breakdown of the Manhattan and Brooklyn markets in Q4 by both segment and price.

Download our full report here.

Compass_Logo_H_W.png
  • Instagram
  • Facebook
  • LinkedIn
  • YouTube

Isil Yildiz Team

110 5th Avenue

New York, NY 10011


985-714-4470

Isil@Compass.com

realtor-logo-white-png-9-transparent.png

Compass is a licensed real estate broker and abides by Equal Housing Opportunity laws. All material presented herein is intended for informational purposes only. Information is compiled from sources deemed reliable but is subject to errors, omissions, changes in price, condition, sale, or withdraw without notice. No statement is made as to accuracy of any description. All measurements and square footages are approximate. Exact dimensions can be obtained by retaining the services of an architect or engineer. This is not intended to solicit property already listed.

bottom of page